Testing the Polymarket insider trading claim with Taleb-proof methods. The answer is stranger than insider trading.
Over the past few years, as Polymarket has moved from niche to mainstream, the same claim has bubbled up every few months. There has to be insider trading happening on Polymarket. What followed was some great work: Joshua Mitts at Columbia Law and Moran Ofir at Haifa have a 2026 working paper estimating $143 million in "abnormal profits" from informed trading on the platform based on trade timing. There's also a solid arXiv paper on the anatomy of Polymarket's 2024 election market. Blockchain firm Chainalysis identified at least 10 wallets belonging to a single French trader named "Theo" whose ~$85M in profits dominate the leaderboard.
What the literature lacked was a Taleb-proof calibration audit. Brier scores. Rank correlations. Outlier-robustness. The question: are these people actually good forecasters, or is the leaderboard a concentration ranking of one directional bet on the 2024 election? This study provides the answer.
The analysis was built to withstand Taleb-style scrutiny, because an audit that cannot survive a quant with a grudge on X is not worth publishing. The reader is the judge.
Five numbers to remember
- 2.02xWithin the top 100, the worst-calibrated quartile earns 2.02 times the median profit of the best-calibrated quartile. On Polymarket, worse calibration is associated with moderately higher profits among the top 100.
- +0.42Spearman rank correlation between Brier score and realized profit: +0.423(p = 1.2e-5). Bootstrap 95% CI: [+0.25, +0.57]. Kendall's tau confirms at +0.29. The correlation holds steady after dropping the top 10 by profit (+0.41), ruling out outlier-driven noise. On Polymarket, worse calibration predicts bigger profits.
- 21/10021 of 100 wallets with 5+ resolved positions scored worse than a coin flip (Brier above 0.25). Several of them are in the top 15 by realized profit.
- 70.7%Median single-event concentration across the top 100. The average whale earned the majority of their money from one market. 27 of the top 100 had a 2024 election market as their single biggest profit source, together accounting for $33.8M (29% of aggregate profit).
- 8 / 8After removing the four wallets publicly attributed to "Theo" by Chainalysis, 8 wallets still show a same-day sweep pattern on popular-vote markets in a narrow window around election day. Combined: $7.2M risked, $12.3M captured, IQR of 8 days centered on October 31, 2024.
All numbers are reproducible from public Polymarket APIs. The full 47-column CSV is linked at the end.
Methodology
The study tests whether Polymarket's all-time profit leaderboard rewards forecasting skill. For each of the top 100 wallets, the analysis:
- Pulled the full trade-fill history from Polymarket's public data API (capped at 2,000 fills per wallet).
- Resolved each fill against the matching market via Polymarket's gamma-api events endpoint.
- Aggregated fills into unique positions (keyed on
conditionIdand outcome index), computing volume-weighted entry prices and total risked capital per position. - Computed per-wallet Brier score (with Murphy decomposition), realized P&L, single-event concentration ratio, and volume-weighted average winning entry price.
95 of the 100 wallets had at least 5 resolvable positions (the remaining 5 had fewer fills or missing resolution data). Total realized P&L across those 95: $115.7M. Total unique resolved positions: 2,838.
A note on fat tails before the findings
The profit distribution across the top 100 is fat-tailed. The Hill estimator (a standard tool for measuring tail heaviness; see Taleb, Statistical Consequences of Fat Tails: Real World Preasymptotics, Epistemology, and Applications, 2020, Chapter 4) returns alpha ~ 1.6 at k=20, which places the distribution in Extremistan territory: infinite variance is plausible, averages are unreliable, and any statistical test designed for Gaussian-distributed data will systematically mislead.
The study therefore uses rank-based correlations (Spearman, Kendall) instead of Pearson, conditional expectations (median profit by calibration group) instead of means, and outlier-stripping robustness checks instead of relying on a single correlation. Everything below follows that protocol.
Finding 1: The leaderboard is a concentration ranking
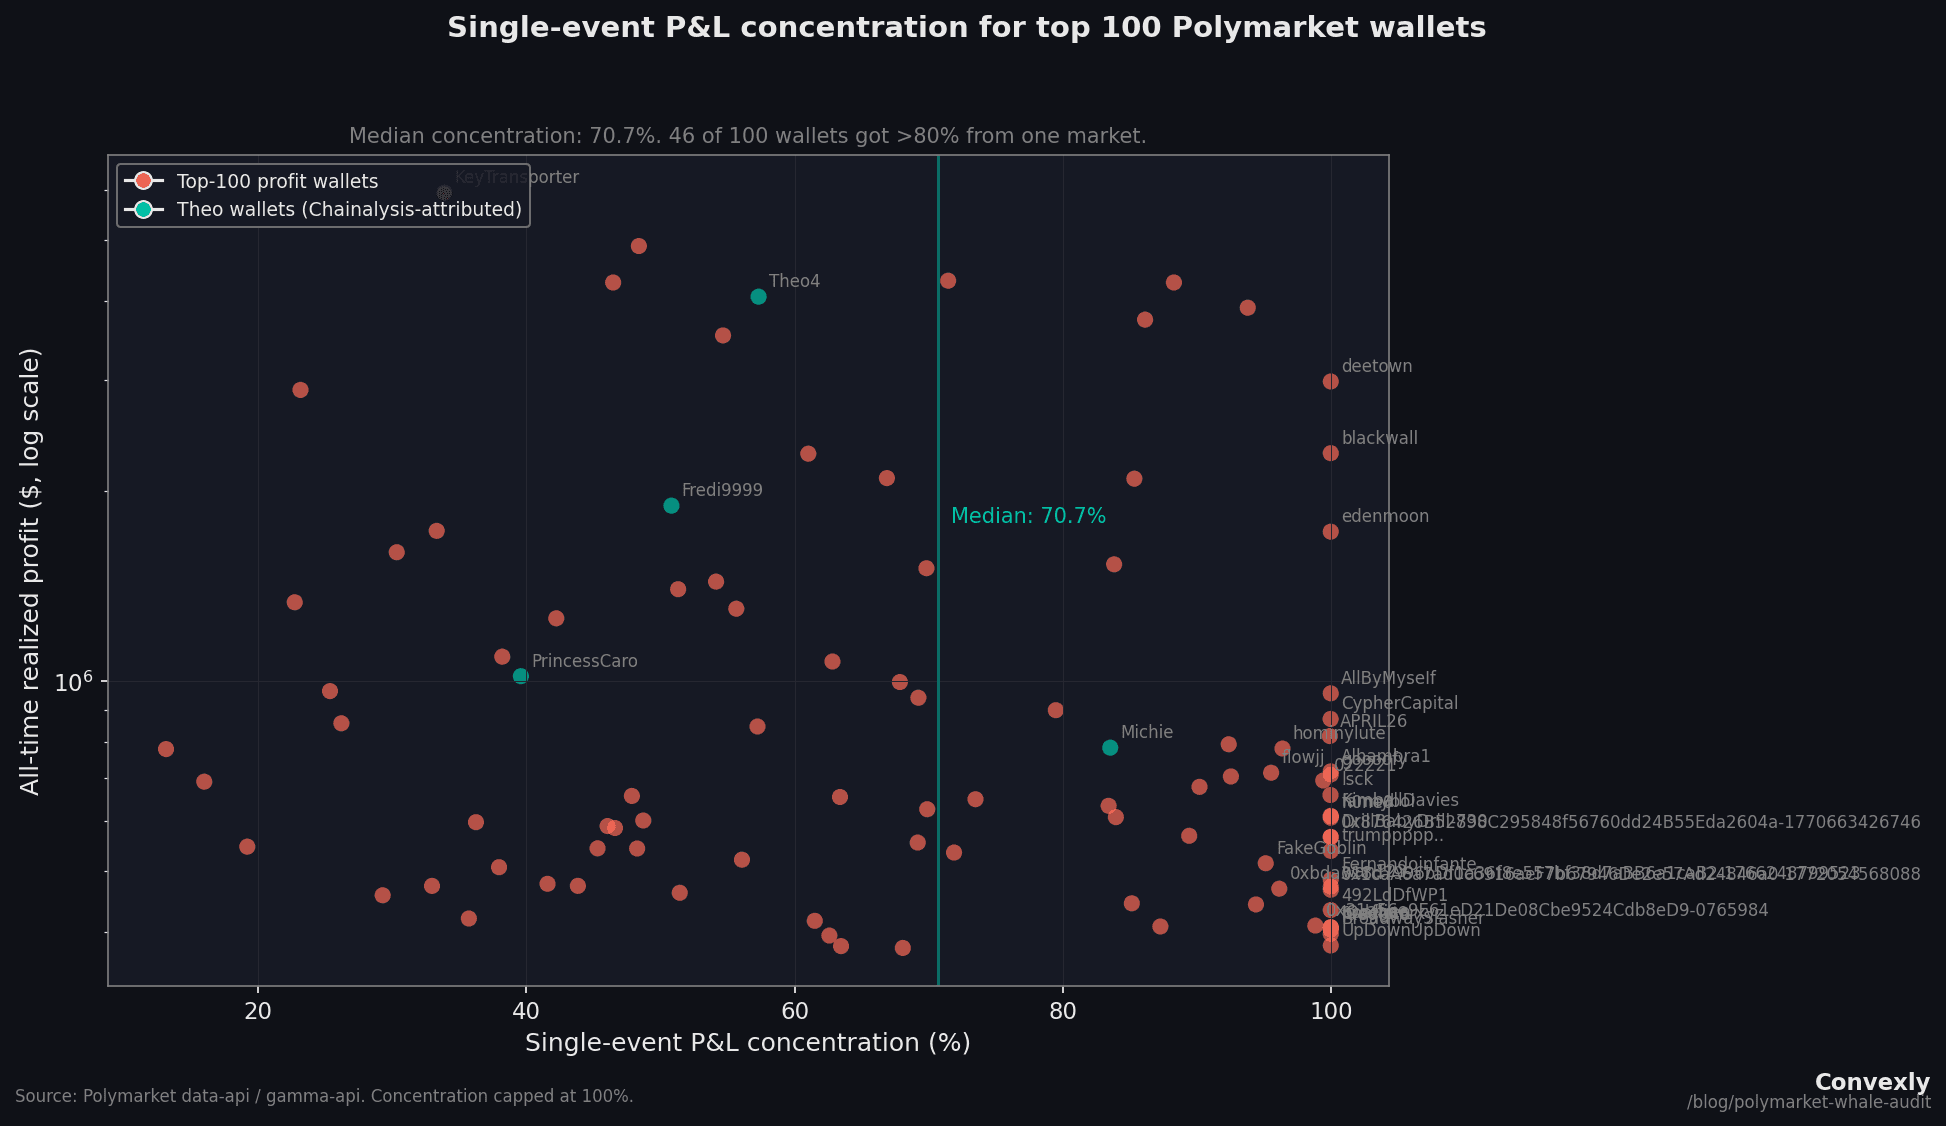
Before any analysis of calibration or insiders, the most important fact about the top 100 is how concentrated their P&L is on a single event.
For each wallet, the study computed the share of total realized P&L from the single largest event. The median across all 100 wallets with concentration data: 70.7%. 46 of those 100 drew over 80% of their money from one market.
27 of the top 100 walletshad a 2024 US election market (Presidential Election Winner, Popular Vote Winner, or state-level results) as their single biggest source of realized P&L. Their combined biggest-event P&L: $33.8M, which is 29% of total realized profit across the 95 valid wallets.
Anyone reading this leaderboard as a ranking of forecasting skill is reading the wrong leaderboard.
Finding 2: Worse calibration predicts bigger profits
A Brier score is the mean squared error between probability forecasts and outcomes. A forecaster who always predicts 50% scores exactly 0.25 on a balanced set of binary questions. For context: NWS weather forecasters score below 0.10 on next-day precipitation. Good Judgement Project superforecasters average about 0.13 on geopolitics. Readers can test their own Brier score in 2 minutes with the Convexly Calibration Challenge.
The top 100 Polymarket whales: mean 0.198, median 0.196. Better than random, but only modestly. And 21 of 100 wallets score worse than 0.25, meaning their probability-weighted forecasts are worse than a coin flip. Several of those are in the top 15 by profit.
Now the real finding. The Spearman rank correlation between Brier score and realized profit. In a market that rewards forecasting skill, this should be negative: better calibration, bigger profits.
It isn't.
![Scatter plot showing Spearman r = +0.423 between Brier score and realized profit for 100 Polymarket whales. Bootstrap 95% CI: [+0.25, +0.57]. Theo's four wallets labeled in blue-teal.](/_next/image?url=%2Fresearch%2Fpolymarket-whale-audit%2Fwhales_profit_vs_calibration.png&w=3840&q=75&dpl=dpl_2haug42LpPJFKoTinXqwscJ46bvA)
Spearman r = +0.423(p = 1.2e-5). Kendall's tau confirms at +0.29 (p = 2.1e-5). Both rank-based and robust to monotonic transformations. Both highly significant.
Does this survive outlier removal?
| Drop top-k by profit | Spearman r |
|---|---|
| Drop top-1 | +0.42 |
| Drop top-5 | +0.38 |
| Drop top-10 | +0.41 |
The correlation holds steady after removing the biggest profit wallets (+0.42 to +0.41 after dropping the top 10). This rules out outlier-driven noise. The signal is a property of the distribution, not one trader pulling the line.
The Taleb-proof version of the finding
Rather than relying on a single correlation coefficient, here is the conditional-expectation version:
Median profit (Brier > 0.25): $1,256,508 (n=21)
Median profit (Brier ≤ 0.25): $625,593 (n=79)
Ratio: 2.02x
The worst forecasters on the leaderboard earn about twice what the best forecasters earn. This is a nonparametric, rank-free, outlier-robust statement about conditional expectations in a fat-tailed distribution.
Finding 3: The October 2024 popular-vote cluster
This is the finding that sits on the boundary between pattern recognition and inference.
First, the required context. Chainalysis published in November 2024 that at least 10 wallets on Polymarket were controlled by a single French former bank trader publicly known as "Theo." The confirmed wallets include four that sit in the top 100: Theo4 (rank 1, $22M), Fredi9999 (rank 2, $16.6M), PrincessCaro (rank 8, $6.1M), and Michie (rank 30, $3.1M). Theo has been interviewed by WSJ, Bloomberg, and 60 Minutes. His methodology is public: he commissioned private YouGov neighbor-polling in swing states, decided the market was mispricing Trump, and spread orders across multiple accounts to manage market impact. This is the opposite of insider trading. It is a sophisticated quant with a proprietary data advantage.
With Theo's wallets accounted for, the analysis examined what remains.
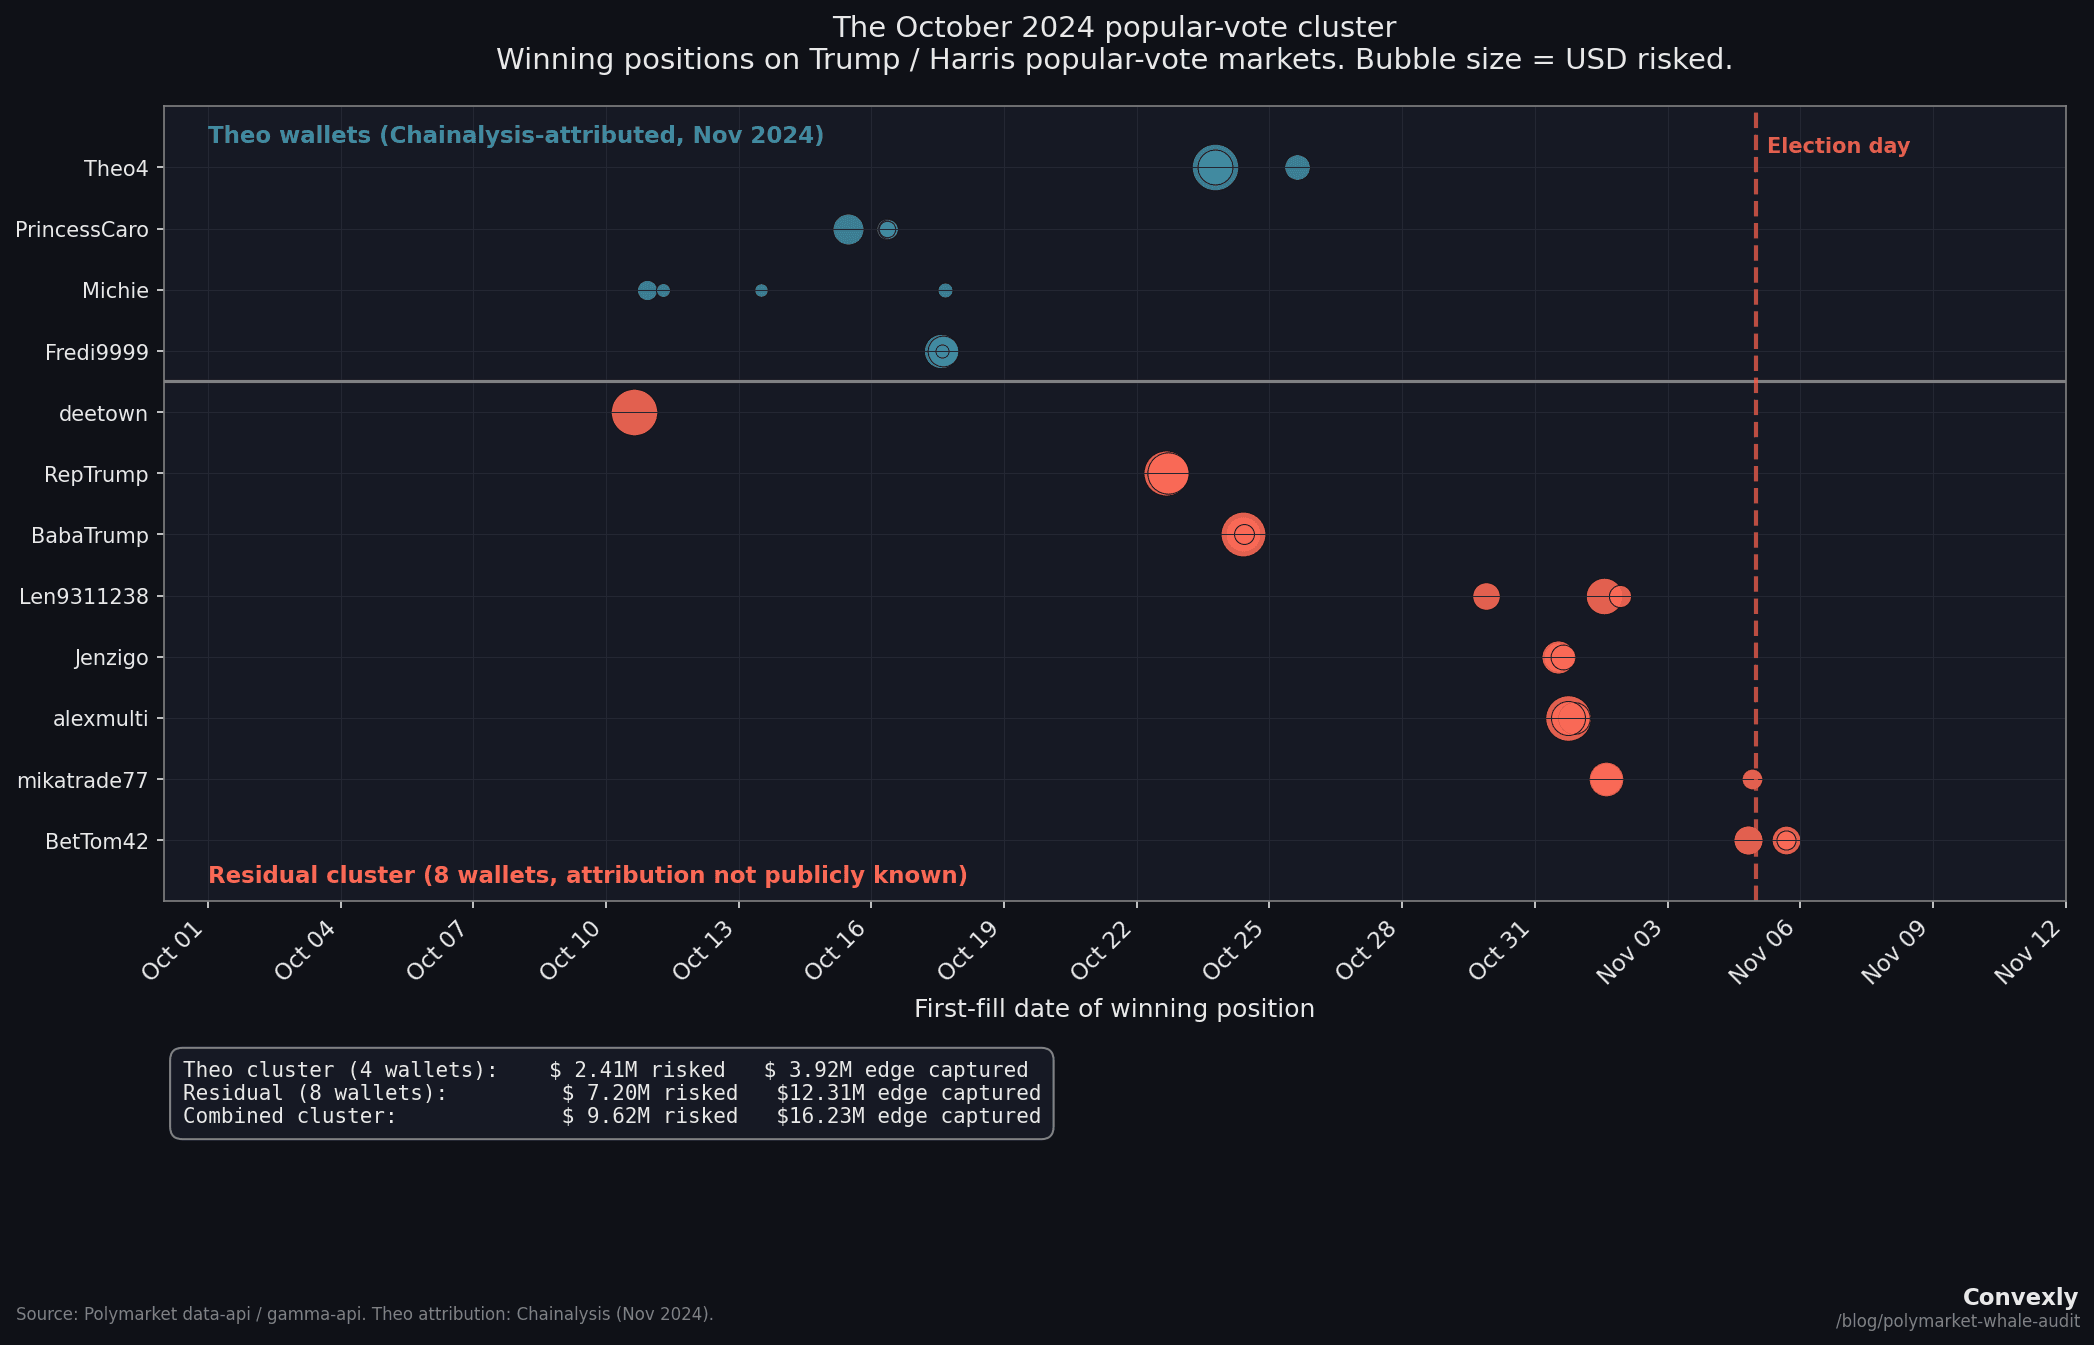
The residual cluster
After removing Theo's four confirmed wallets from the set, 8 walletsremain that placed concentrated bets on the popular-vote markets in a narrow window around election day. They bet on three linked markets: "Will Donald Trump win the popular vote?", "Kamala Harris wins the popular vote?" (bet NO), and "Will a Republican win the popular vote and the Presidency?"
| Wallet | Date | Pos | Avg entry | Risked | Edge captured |
|---|---|---|---|---|---|
| deetown | Oct 10 | 1 | 35.1% | $1.14M | $2.20M |
| RepTrump | Oct 22 | 3 | 39.3% | $1.51M | $2.19M |
| BabaTrump | Oct 24 | 3 | 39.0% | $1.21M | $1.84M |
| Len9311238 | Oct 29-Nov 1 | 3 | 36.8% | $549K | $963K |
| Jenzigo | Oct 31 | 3 | 37.4% | $491K | $824K |
| alexmulti | Oct 31 | 3 | 37.1% | $1.41M | $2.36M |
| mikatrade77 | Nov 1-4 | 3 | 37.3% | $575K | $1.10M |
| BetTom42 | Nov 4-5 | 3 | 28.2% | $325K | $829K |
| Combined | $7.20M | $12.31M | |||
IQR of first-fill dates: 8 days, centered on October 31. Every one of these wallets placed multiple six-to-seven-figure positions on the same day across linked popular-vote markets, at implied odds of 28% to 29%.
BetTom42 is the most striking: three positions entered on election eve and election day itself at 28% implied odds. The market was giving Trump a roughly 28% chance of winning the popular vote on the day he won it.
Important caveats
Chainalysis identified at least 10 wallets belonging to Theo, and only 4 are publicly confirmed by name. Up to 6 more of these 8 residual wallets could be additional Theo accounts that cannot be verified without on-chain funding-flow analysis. The cluster is a real descriptive finding, but the number of truly independent traders in it is unknown.
Notably, Chainalysis did not link BetTom42 or alexmulti to the Theo cluster, which means at least two of the eight residual wallets are confirmed independent.
What would a regulator think?
No specific wallet is being accused. The finding is a pattern in public data. But Polymarket received CFTC approval as a Designated Contract Market (DCM) in November 2025, which means two provisions of the Commodity Exchange Act are now live:
- CFTC Rule 180.1prohibits the use of any manipulative or deceptive device in connection with commodity contracts. Trading on material nonpublic information is relevant, though the legal framework for prediction markets is still evolving and enforcement mechanisms remain untested (see Mitts & Ofir, 2026, for a detailed analysis of the regulatory gaps).
- Commodity Exchange Act sections 4c and 6c empower the CFTC to investigate traders whose order flow shows signs of information advantage.
A compliance analyst at a DCM looking at the residual cluster would see: 8 accounts, concentrated on one event, entry prices at 28-39% on the side the market priced as a 2-to-1 underdog, combined $12.3M captured. That pattern gets a review. Not because it proves anything, but because precautionary-principle regulatory frameworks (see Taleb, Silent Risk: Lectures on Fat Tails, (Anti)Fragility, and Asymmetric Exposures, 2015) treat patterns as actionable when the downside of ignoring them is asymmetric.
Three explanations, all consistent with the data:
- Independent contrarian conviction.Each of these 8 wallets independently decided the market was mispricing Trump's popular-vote chances. They sized up, were correct, and kept their winnings. Plausible for one or two wallets. For eight, in the same week, on the same market, it stretches.
- Coordinated or herded positioning.A small network made the same bet at roughly the same time, either by direct coordination or by following observable flow (e.g., watching Theo's known accounts move). Legal on a prediction market, but statistically distinct from (1).
- Information-based trading. Someone had nonpublic data (internal polling, early exit polls, voter-file analytics) that gave them confidence the market lacked. This is what Rule 180.1 would address at a DCM, assuming the framework is interpreted broadly enough to cover prediction markets.
The data alone cannot distinguish between these. Distinguishing them requires evidence unavailable in this dataset: per-fill timing relative to specific information-disclosure events, wallet-to-identity attribution, and the actual source of each trader's conviction.
What the study cannot conclude
The findings above describe patterns. They do not prove any specific wallet violated any specific rule. Several limitations are worth naming explicitly:
- Survivorship bias. The top-100 profit leaderboard is the right tail of a fat-tailed distribution. Under any null hypothesis, someone will be in the top 100 by luck alone. The correct comparison would be this top 100 vs a random sample of all ~50,000+ Polymarket accounts. That data is not available.
- Small-sample Brier is noisy.Some wallets have as few as 5 resolved positions. At a strict threshold of 25+ positions, the "worse than random" count drops from 21/100 to 1/36. At 50+ positions (n=12), none score worse than random. The calibration-profit correlation holds at 25+ positions (r = +0.43, p = 0.008) but is not significant at 50+ (r = +0.31, p = 0.33, n=12 is too small).
- Fill-level timing relative to information events is not observable. A wallet that bought "Trump wins popular vote" in July 2024 at 25% is doing something very different from a wallet that bought it on November 4 at 25%. The aggregate analysis treats them identically. This matters for the insider question.
- Correlated outcomes.Multiple bets on the same event (Trump wins popular vote, Trump wins presidency, Republican wins Wisconsin) are not independent. A wallet with 4 "wins" on correlated election outcomes has an effective sample size closer to 1-2, not 4. Any per-wallet significance test that assumes independence is structurally flawed.
- One wallet is not one trader. Some accounts are likely funds, DAOs, or syndicates. Others are individuals.
- No wallet is being accused. None of the named wallets are alleged to have done anything illegal.
Related work
This calibration audit complements three existing lines of research on Polymarket:
- Mitts & Ofir (2026), "From Iran to Taylor Swift: Informed Trading in Prediction Markets." Timing-based insider-trading detection using a five-signal composite score on 93,000+ markets and 50,000 wallets. Found $143M in abnormal profits. Their research question is "who traded on insider info?" The Convexly question is "does the leaderboard reward forecasting skill?" Different methodology, complementary findings.
- Tsang & Yang (2026), "The Anatomy of Polymarket: Evidence from the 2024 Presidential Election." Market-level microstructure analysis. Volume decomposition, Kyle's lambda, three-episode framework. Does not compute per-wallet calibration or profit metrics.
- Reichenbach & Walther (2025) analyzed 124 million Polymarket trades for accuracy, skill, and bias at the trader level, finding that only 30% of traders are profitable and that trading skill is persistent. Their skill metric is profit persistence, not Brier calibration.
None of these works compute per-wallet Brier scores, calibration-vs-profit rank correlations, or single-event concentration ratios. This contribution sits in that gap.
Methodology (reproducible from public APIs)
Everything in this post comes from public Polymarket endpoints. No credentials, no scraping of logged-in pages. Anyone with Python and an afternoon can reproduce the numbers.
Data source and rights. Polymarket public data API and on-chain fills (public_observable; redistribution rights under review). Convexly does not assert a license over the underlying market data, holds no position on Polymarket, and is independent and not affiliated with Polymarket. Polymarket is a trademark of its owner.
- Wallet selection. Top 100 by all-time profit from
polymarket.com/leaderboard/overall/all/profit. The list starts with Theo4 at rank 1 ($22.05M) and ends with Dropper at rank 100 ($1.03M). - Trade fills. For each wallet:
data-api.polymarket.com/activity?user=<addr>&type=TRADEwith pagination, capped at 2,000 fills per wallet. - Resolution lookup. Each fill carries a
conditionIdandeventSlug. Resolution usesgamma-api.polymarket.com/events?slug=<eventSlug>, which returns the parent event with nested markets. Each fill'sconditionIdis matched to the nested markets to obtain final outcome prices. - Position deduplication. Fills aggregated into unique positions keyed on (conditionId, outcome_index). Volume-weighted average entry price per position. Total unique resolved positions: 2,838. Without this step, the same $1M bet appears 80 times and calibration metrics become meaningless.
- Brier scoring.For each resolved position: implied probability = volume-weighted entry price. Outcome = 1 if resolved in wallet's favor, else 0. Per-wallet Brier = mean squared error across all resolved positions. Also computed Murphy decomposition into reliability, resolution, uncertainty.
- Rank correlations and robustness. Spearman and Kendall rank correlations between Brier and realized profit. Bootstrap 95% CI (10,000 resamples). Outlier-stripping (drop top-k by profit, recompute). Conditional expectations by Brier category. Hill alpha for fat-tail verification (Taleb, Statistical Consequences of Fat Tails, 2020).
- Concentration metric.For each wallet: the single event contributing the largest absolute realized P&L, and its share of total wallet P&L.
How to verify a single wallet yourself
Pick any wallet from the CSV. Substitute its address into <wallet> below and run:
curl "https://data-api.polymarket.com/activity?user=<wallet>&type=TRADE&limit=5"The response is JSON with the first 5 fills, including slug, eventSlug, conditionId, price, side. Resolve any of those events:
curl "https://gamma-api.polymarket.com/events?slug=presidential-election-winner-2024"Look for outcomePrices in the nested markets array. Match by conditionId. The rest is arithmetic.
The data
Full dataset: 100 wallets, 47 columns. Brier decomposition, win rates, entry-price distributions, event concentration, edge captured, consensus-defying rates, biggest-event identifiers. Use it freely. To flag something the study missed, email research@convexly.app.
Download polymarket-whales-data.csv (32 KB)We plan to publish updated whale audits quarterly. Get the next one in your inbox:
Bottom line
The Polymarket profit leaderboard is not a ranking of the platform's best forecasters. It is a ranking of whoever bet biggest on a small number of concentrated events, with the 2024 US Presidential Election dominating the list. The worst-calibrated whales earn about 2x the median profit of the best-calibrated whales, and this correlation is robust under every test the study ran.
Inside that leaderboard is one publicly-documented trader (Theo) who controls at least 10 wallets and earned ~$85M through a legitimate proprietary polling advantage. After removing Theo's known wallets, 8 wallets remain in a narrow cluster on the popular-vote markets, placing concentrated same-day sweeps at 28-39% implied odds in the weeks around election day. Combined captured edge: $12.3M. Whether any of them had nonpublic information is a question trade data alone cannot answer. But the pattern exists, the data is public, and the CSV is one click away.
Polymarket is now a DCM under the CFTC. Under the precautionary frameworks that govern regulated exchanges, patterns like this one get investigated. Whether anyone investigates is a question for Polymarket's compliance team and the CFTC. Convexly just ran the numbers.
Follow-up research. Convexly ran this analysis on all 9,997 wallets on the Polymarket profit leaderboard (not just the top 100). The top-100 finding replicates at r = +0.39, but across the full leaderboard the calibration / profit correlation drops to r = +0.148. Calibration barely predicts profit outside the top 100. Sizing and concentration dominate. Read it: Scoring 10,000 Polymarket Wallets.
Convexly: calibration, sizing, and concentration in one tool
Most prediction-market analytics copy the whales or chase P&L. The Convexly 10K-wallet follow-up showed that calibration alone barely predicts profit; sizing and concentration dominate. Convexly covers all three: per-category calibration, position-sizing diagnostics, and concentration share. Paste a Polymarket wallet and see the profile in 30 seconds. No signup for the free tool.
Related answers
- What are the best Polymarket wallets to study? (the PnL leaderboard is the wrong filter)
- Is there a free Polymarket wallet tracker?
- Is there a Polymarket scanner that ranks the full cohort?
- PnL vs Edge Score. Top 20 by PnL vs top 20 by Edge Score, side by side.
Published by Convexly. Data aggregated and compiled using Anthropic's Claude. All statistical methods, interpretations, and editorial decisions are human-authored. The full dataset and methodology are provided for independent verification. Convexly holds no position on Polymarket and no financial interest in any named wallet.