Cross-market scan · Polymarket · 2026-05-13
Hantavirus cluster: cross-market mispricing scan
Manual scan conducted while the full CME pipeline indexes the cluster. Full Trust cards and automated CME signals expected within 24h.
Five Polymarket events on hantavirus trade as a loosely coupled cluster: a US-case gate, a WHO PHEIC gate, a cohort-specific lab-leak gate, a year-end pandemic gate, and an FDA-approval gate on vaccines. The cluster is outside the Convexly daily CME pipeline universe (5,000-market cap, liquidity-weighted), so the daily signal report does not cover it. This page documents a manual cross-market belief decomposition. One market shows a meaningful gap on the joint pandemic / PHEIC ratio; the four others are either internally consistent or within thin-liquidity friction of a defensible baseline.
Cluster snapshot
Five linked markets
All five markets are active at snapshot time, with cumulative volume across the cluster of approximately $10.07M and total liquidity of $2.32M. The pandemic market carries about 83% of cluster liquidity on its own; the US-case market carries less than 1%.
| Market | YES | Liquidity | Volume | Resolves | Flag |
|---|---|---|---|---|---|
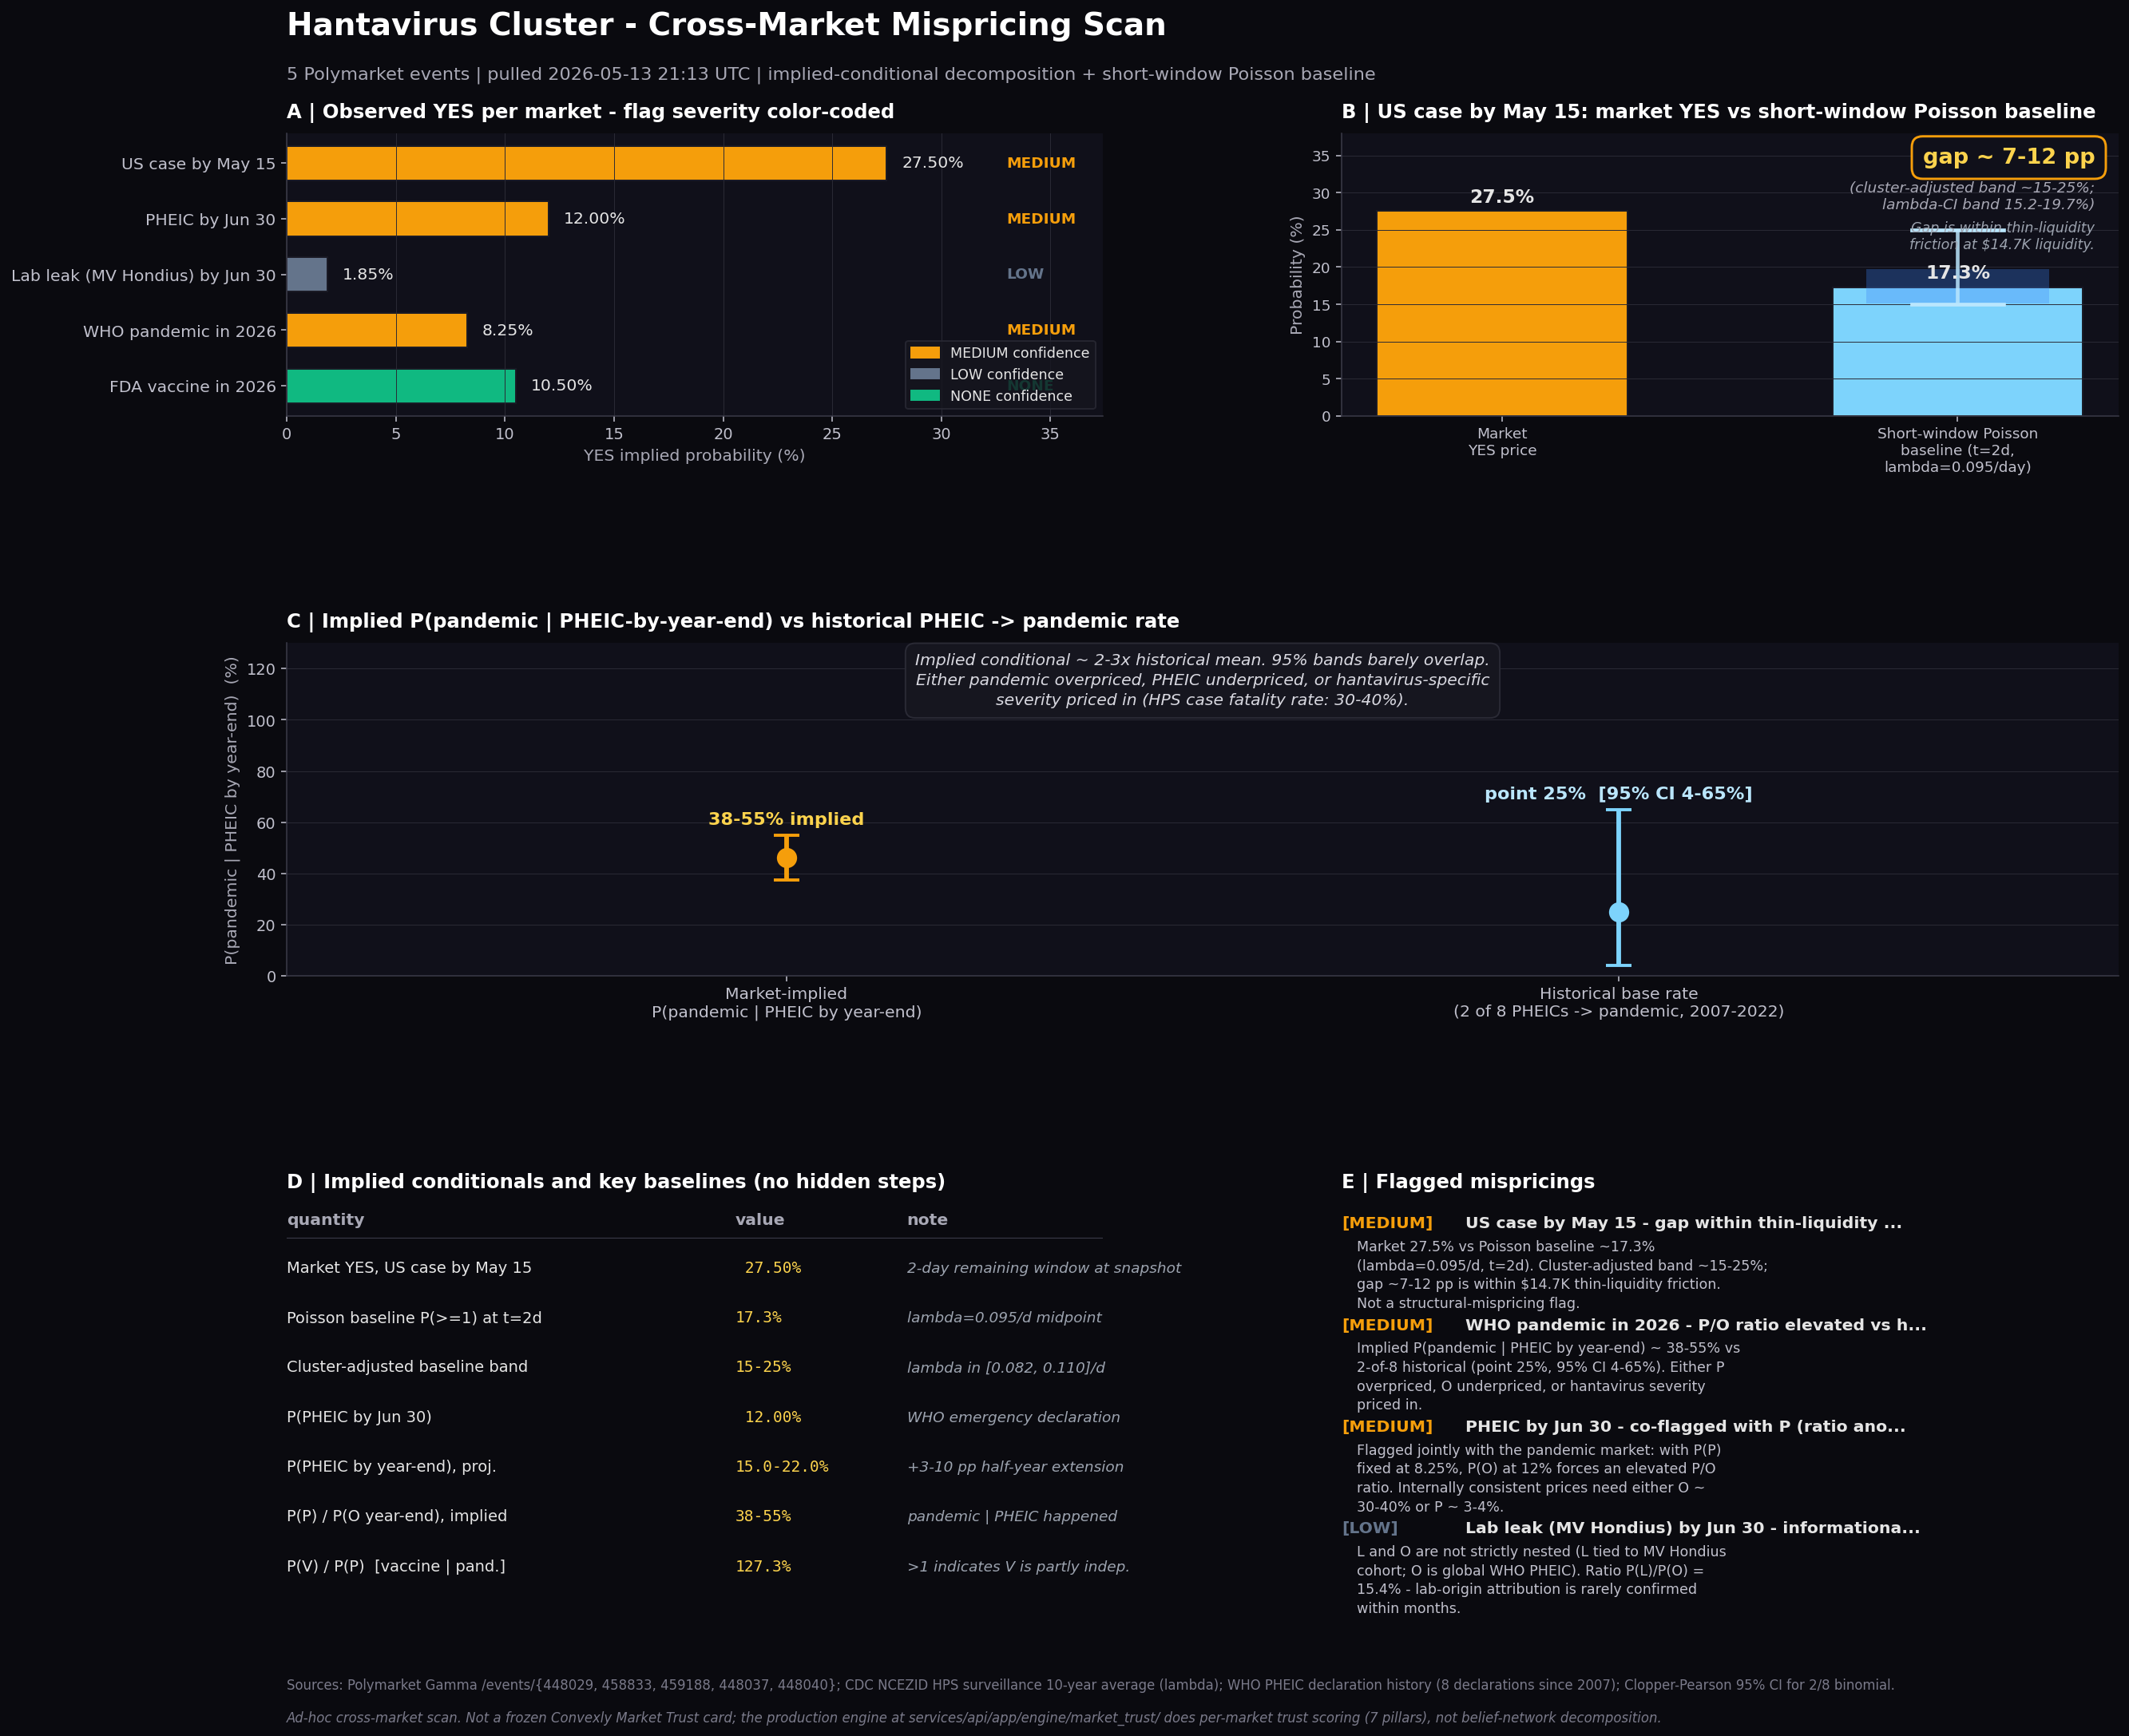
| US case by May 15 | 27.50% | $14.7K | $0.73M | 2026-05-15 | MEDIUM |
| PHEIC by Jun 30 | 12.00% | $6.2K | $13.0K | 2026-06-30 | MEDIUM |
| Lab leak (specific outbreak) by Jun 30 | 1.85% | $317.0K | $190.0K | 2026-06-30 | INFO |
| WHO pandemic in 2026 | 8.25% | $1.92M | $9.06M | 2026-12-31 | MEDIUM |
| FDA vaccine in 2026 | 10.50% | $53.4K | $80.0K | 2026-12-31 | — |
Source: Polymarket Gamma /events/{448029, 458833, 459188, 448037, 448040} (public_observable; redistribution rights under review). YES = outcomePrices[0] at snapshot time. Polymarket midpoints are public market observables used here as a reference input; Convexly does not assert a license over the underlying data and is independent and not affiliated with Polymarket.
Finding 01
MEDIUM CONFIDENCECORRECTED 2026-05-13Short-horizon Poisson baseline vs. thin liquidity
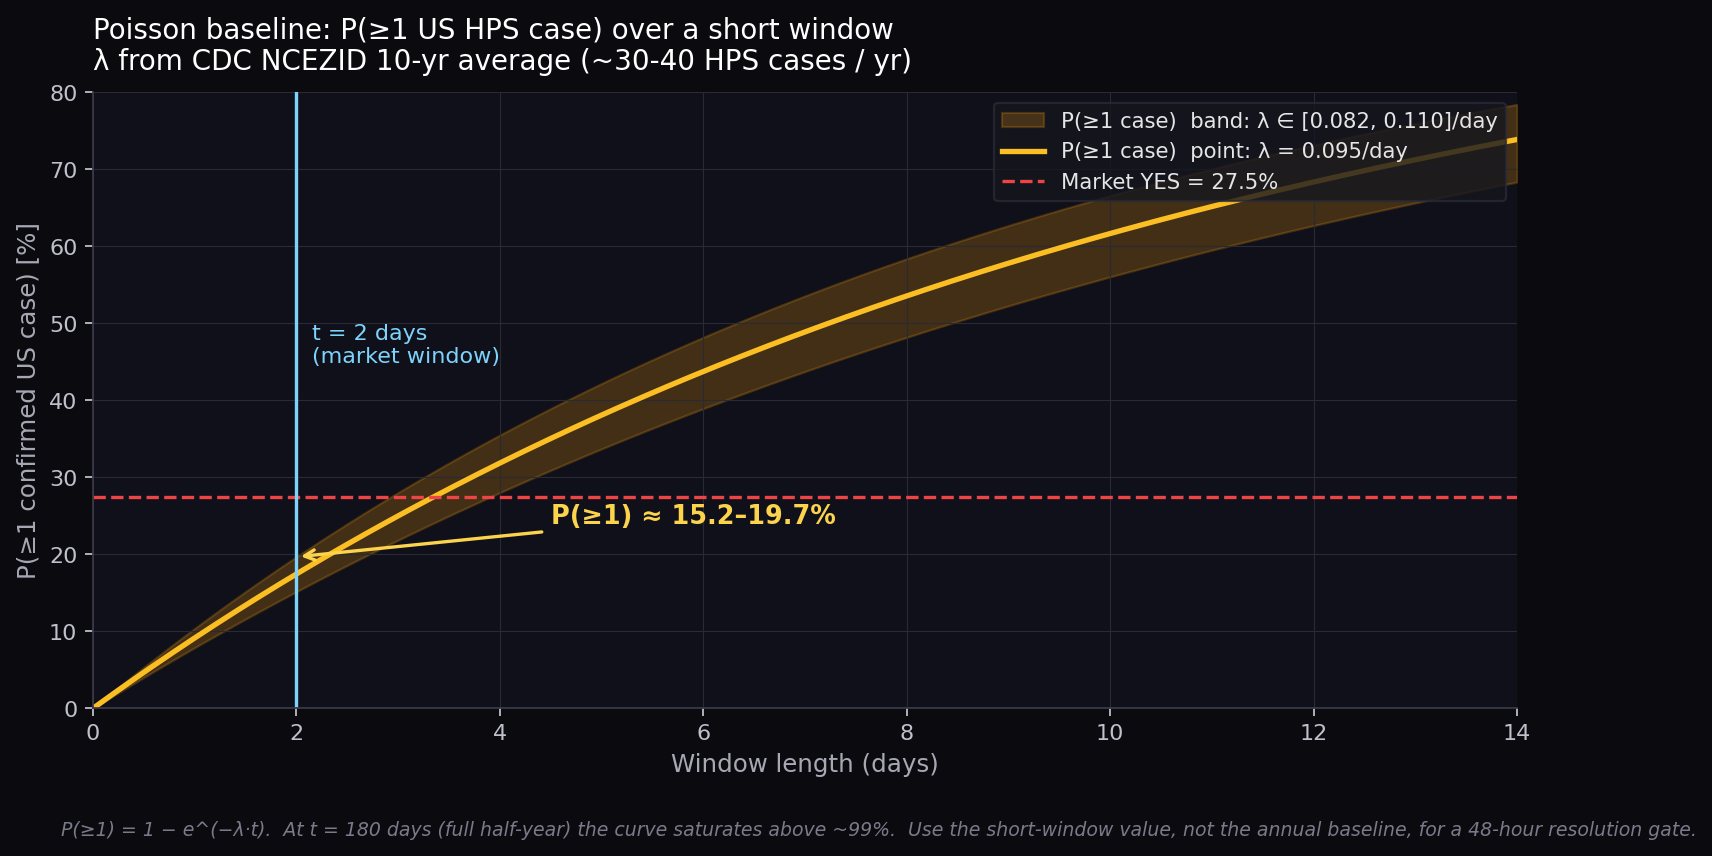
The market Confirmed case of Hantavirus in US by May 15? resolves YES on any laboratory-confirmed hantavirus infection within U.S. territory between market creation and May 15. The CDC NCEZID 10-year average for hantavirus pulmonary syndrome (HPS) is roughly 30-40 US cases per year, which is a daily intensity of λ ≈ 0.082-0.110 cases/day. At snapshot the market has 48 hours left, so the relevant baseline for a NEW qualifying case appearing in that window is the Poisson tail:
with λ = 0.095 cases/day (midpoint) and t = 2 days
⇒ P(≥1) ≈ 1 − e^(−0.190) ≈ 17.3%
band over λ ∈ [0.082, 0.110]/day: 15.2% - 19.7%
A modest upward adjustment for the MV Hondius cruise-ship cluster narrative pushes the realistic baseline slightly above the long-run Poisson rate. A pragmatic range is ~15-25% depending on how much weight is placed on cluster-specific risk. The market trades at 27.50% YES, leaving an implied gap of roughly 7-12 pp over the midpoint of the cluster-adjusted baseline. At $14.7K of liquidity this is well within the cost band imposed by spread, slippage, and capital lockup; no flag of structural mispricing follows.
Quotable
Polymarket's “Confirmed US hantavirus case by May 15” at 27.50% YES has about two days left at snapshot. The right baseline is the short-window Poisson probability, not the annual rate: P(≥1) = 1 − e^(−λ·t) with λ ≈ 0.095 cases/day from the CDC 10-year HPS average gives ~17.3% at t = 2 days (band 15.2-19.7%). Adjusted upward for the MV Hondius cluster, ~15-25%. The implied gap of roughly 7-12 pp is consistent with the friction band imposed by $14.7K of liquidity. Not a structural mispricing.
Finding 02
MEDIUM CONFIDENCEImplied P(pandemic | PHEIC by year-end) is ~38-55%, vs ~25% historically [95% CI 4-65%]
The pandemic-by-2026 market (8.25% YES) and the PHEIC-by-June-30 market (12% YES) jointly imply a conditional. Extending PHEIC-by-June-30 to PHEIC-by- year-end adds roughly +3 to +10 percentage points depending on the time-decay assumption, giving an implied P(PHEIC by year-end) of about 15-22%. Under the informal precondition that WHO pandemic characterization presupposes a PHEIC, the implied conditional is P(pandemic | PHEIC by year-end) ~ 38-55%.
The historical base rate, drawn from the eight PHEIC declarations WHO has issued since 2007, is 2 of 8 that received an explicit WHO “pandemic” characterization: 2009 H1N1 and 2020 COVID-19. The other six (polio 2014, Ebola West Africa 2014, Zika 2016, Ebola Kivu 2018, mpox 2022, mpox clade Ib 2024) did not. Point estimate 25%, 95% Clopper-Pearson interval [4%, 65%] on n = 8.
The market-implied conditional sits at the high end of the historical 95% band but does not fully clear it. Three readings are consistent with the data: (i) pandemic-2026 is overpriced relative to the PHEIC gate; (ii) PHEIC-by-June-30 is underpriced relative to the pandemic gate (i.e., internally consistent prices would require P(PHEIC) closer to 30-40%); or (iii) the market is correctly pricing in hantavirus-specific severity. HPS case fatality runs 30-40% in the US per CDC, well above H1N1 or COVID; a rational trader could believe that any hantavirus PHEIC is more likely than past PHEICs to escalate to a pandemic characterization.
Quotable
Polymarket's hantavirus pandemic-2026 market (8.25% YES) and PHEIC-by-June-30 market (12% YES) jointly imply P(pandemic | PHEIC by year-end) of approximately 38-55%. The historical PHEIC-to- pandemic rate is 2 of 8 declarations since 2007 (point 25%, 95% Clopper-Pearson 4-65%). The implied conditional sits at the high end of the historical band. The reading is ambiguous: either pandemic is overpriced, PHEIC is underpriced, or the market is pricing in hantavirus case-fatality severity.
Not flagged
Three markets are internally consistent
The remaining three markets do not show structural gaps under the cross-market scan.
- Lab leak (specific outbreak) by Jun 30 - 1.85% YES. The market is scoped to an outbreak cohort referenced in its description, not a generic hantavirus lab-origin claim. P(L) / P(O) = 15.4% is reasonable given lab-origin attributions are rarely confirmed within months. Listed as informational.
- WHO pandemic in 2026 - 8.25% YES. Flagged jointly with the PHEIC market in Finding 02, but not as a standalone mispricing. The internal ratio is the issue, not either price in isolation.
- FDA vaccine in 2026 - 10.5% YES. P(V) > P(P) is internally defensible. FDA approval depends on independent R&D pipelines (multiple hantavirus vaccine candidates exist in Phase 1-2 trials) and does not require a pandemic declaration as a precondition.
Methodology
The scan is a manual cross-market belief decomposition. For each pair or triple of logically related markets, we compute the implied conditional probability (e.g., P(P) / P(O) gives the implied P(P | O), assuming a causal precondition). We then compare the implied conditional to an external historical or base-rate reference, with explicit confidence bands on both the implied conditional and the historical reference.
A market is flagged HIGH only when the implied gap to a defensible external reference is large (tens of percentage points or more) AND the gap is not plausibly explained by a base-rate disagreement of comparable magnitude. MEDIUM flags surface joint cross-market-ratio anomalies. LOW (informational) flags surface ratios worth reading without claiming a mispricing.
Confidence intervals on historical base rates use Clopper-Pearson exact binomial bands. Implied conditionals carry an explicit range driven by the uncertainty in projecting PHEIC-by-June-30 forward to PHEIC-by-year-end (here, +3 to +10 percentage points). No formal hypothesis test is run; the scan is descriptive, not inferential.
Limits of this scan
What this is not
- Not a Convexly Market Trust card. The production Market Trust engine scores per-market trust on seven pillars (wallet quality, participant quality, coherence, depth/capacity, resolution reliability, manipulation risk, freshness) and does not currently do cross-market belief decomposition. That is a real gap; this page is one example of what filling it could look like.
- Not a frozen pipeline output. The Convexly daily CME pipeline runs on the top 5,000 markets by liquidity. All five hantavirus markets sit below that cap. The scan was assembled manually; it has not been pre-registered and does not carry an AsPredicted ID.
- Not a trade recommendation. The US-case market has $14.7K of liquidity and resolves on 2026-05-15, about two days from snapshot. The ~7-12 pp gap to a cluster-adjusted short-window Poisson baseline is well within the friction band imposed by that depth. Use the analysis to think about the cluster; do not infer a trade.
- Not a peer-reviewed finding. The base rates used here (CDC HPS surveillance, WHO PHEIC register) are publicly sourced and cited inline. The flag thresholds and the PHEIC-projection band are author-set. A reader who disagrees with either is free to recompute the conditionals on their own assumptions; the snapshot values above are the inputs they would need.