Cross-venue coefficient divergence and the sweepcash sensitivity check
Convexly Research. 18,105,158 Manifold bets. 15,106 users after a 20-resolved-bet floor. Within-user paired comparison across the sweepcash window. Three cross-venue findings, updated with the 2026-05-04 politics-excluded sensitivity rerun prompted by Tod Waddington's catalog-confound note.
Methodology update 2026-04-27
The V1.5 deferred experiments (per-wallet temporal holdout E2, per-quarter IC stability E7) ran on the V1-M position tape. Both pre-registered primary tests failed their ex-ante thresholds. The honest reframing: V3b is a cross-sectional ranker of wallet behavior, not a per-wallet temporal predictor. Cross-venue invariance (this paper) and cross-wallet ranking hold up; per-wallet temporal alignment with PnL does not. Full V1.5 result at /research/edge-score-methodology-v1-5. Methodology disclosure with all caveats at /methodology.
Methodology update 2026-05-04
Tod Waddington flagged that the sweepcash window overlapped Manifold's 2024-US-election catalog, so the published window comparison needed a politics-excluded sensitivity check. The recovered-cohort rerun recovers 15,027 of 15,106 public V1-M user hashes and is not a byte-identical rebuild of the 2026-04-22 bundle. Baseline recovered cohort: -10.6pp concentration delta, 95% CI [-16.1, -1.4], Wilcoxon p=0.0079 on n=497 of 2,330 paired users with defined concentration delta. Politics-excluded arm: -9.2pp, 95% CI [-12.8, -3.6], Wilcoxon p=0.0021 on n=515 of 1,208. The concentration result survives and attenuates. The published calibration-improvement secondary claim does not replicate and is superseded by this update.
Key findings (TL;DR)
- 1.Concentration is the dominant within-user difference; the calibration secondary claim is superseded. The original public bundle reported median concentration 8.9pp lower in the sweepcash window than in the pre-sweepcash bridge window on 1,647 paired users (n=333 with concentration delta defined; 95% CI [-17.0, -1.1], Wilcoxon signed-rank p = 0.0137). The recovered-cohort sensitivity rerun reports -10.6pp before filtering and -9.2pp after political/election markets are excluded. The earlier calibration-improvement claim (-0.006 Brier, p<0.0001) does not replicate on the recovered cohort and should be read as superseded.
- 2.Discipline pillar flips sign across venues. Polymarket V1 fitted coefficient was −1.15; refit on the 15,106-user Manifold cohort the same coefficient is +0.36 (permutation p = 0.0001). Conviction collapses by a factor of seventeen. The methodology transfers; the coefficients do not.
- 3.Per-user PnL on Manifold is more fat-tailed than on Polymarket. Hill alpha 0.86 on Manifold per-user PnL (95% CI 0.80, 0.93) versus 1.28 on Polymarket (95% CI 1.20, 1.36). Manifold sits below alpha = 1.0, the undefined-mean threshold. Survivorship and ergodicity discussion in §Fat tails.
What this means for traders: if you forecast the same way on Polymarket as on Manifold and use the same skill ranker, you're miscalibrating yourself in opposite directions on the two venues. The right answer is venue-specific Edge Score refits, not a single cross-venue ranking. Run the analyzer on your wallet to see your refitted score.
In September 2024 Manifold Markets, the largest play-money prediction market on the internet, turned on a real-money variant called sweepcash. Selected markets had dual currencies for six months. The same platform and UI, with overlapping users. The question catalog was not fixed; the sweepcash window also overlapped the 2024-US-election market cycle. On March 28 2025 Manifold shut the program down.
This report is about what happened in between.
We pulled every bet Manifold has ever registered, 9,115,727 of them in the public bulk dump plus 8,989,431 from the /v0 API to close the twenty-one-month gap to the present, indexed 130,091 markets, re-fit the Convexly Edge Score composite on the resulting cohort of 15,106 users, and then tested how paired users' concentration changed across the sweepcash windows.
Specifically: the original public bundle reported median within-user concentration 8.9 percentage points lower in the sweepcash window than in the pre-sweepcash bridge window. The 95% bootstrap CI of [-17.0, -1.1] excluded zero (Wilcoxon signed-rank p = 0.0137) on the n=333 sub-sample where concentration was defined out of 1,647 paired users; concentration is undefined for users with non-positive total realized PnL in either window. Tod Waddington at Manifold then flagged a catalog confound on 2026-04-30: the sweepcash window overlapped Manifold's 2024-US-election market launches, so users may have diversified across more catalog events for inventory reasons rather than incentive reasons.
The 2026-05-04 recovered-cohort rerun answers that sensitivity question. Before any politics filter, the recovered cohort reports a -10.6pp concentration delta, 95% bootstrap CI [-16.1, -1.4], Wilcoxon p=0.0079 on n=497 of 2,330 paired users with concentration delta defined. After excluding political and election markets, the delta is -9.2pp, 95% CI [-12.8, -3.6], Wilcoxon p=0.0021 on n=515 of 1,208 paired users. The politics filter attenuates the effect by 13.6% relative to the recovered baseline; the CI-excludes-zero conclusion still holds. This is a paired-window comparison, not a randomized intervention, so causal attribution to sweepcash alone remains too strong.
The important correction is on calibration. The published secondary claim said per-bet calibration improved slightly in the sweepcash window (median delta -0.006 Brier, p<0.0001). The recovered-cohort rerun does not replicate that result: baseline pre-to-sweepcash skill_brier delta is +0.00046, 95% CI [-0.0025, +0.0036], p=0.93; politics-excluded delta is -0.00084, 95% CI [-0.0049, +0.0029], p=0.94. The right reading is that the concentration result survives sensitivity; the calibration secondary claim is superseded.
We have not found a published prior within-person test of paired-window behavior on a prediction-market venue with this design; the closest comparison in the literature is Servan-Schreiber, Wolfers, Pennock, and Galebach (2004) at the market-aggregate level across populations. Our approach is one of three cross-venue findings in this paper that argue the same thing, in different dialects: incentive regime is a first-order determinant of how the same measurement framework lands on the same data.
Data
The Manifold cohort is constructed from two sources. The public bulk dump provides every bet and every contract from the platform's launch in December 2021 through July 6 2024: 9.1 million bets, 130,091 markets, 56,139 unique users. We parse the bets file with a two-pass disk-sharded ingestion (first pass computes shard assignments by the first two characters of the userId; second pass rewrites bets into 1,296 per-shard files totalling 2.9 GB). The markets file is streamed with jq and reduced to the fields needed for resolution joins. The /v0 /bets?username= endpoint backfills the gap: 8.99 million bets covering July 2024 through April 2026, fetched with a 32-worker thread pool at roughly twenty bets per second under Manifold's documented 500-per-minute per-IP rate limit.
After merging, we apply the V1-M inclusion criteria. Resolved BINARY cpmm-1 markets and resolved MULTIPLE_CHOICE cpmm-multi-1 markets with a specific winning answerId. Non-redemption, non-cancelled bets only. A floor of twenty resolved bets per user. The final cohort is 15,106 users whose aggregated per-user statistics are released alongside this post at /research/v1m/v1m-data-bundle.tar.gz; user identifiers are hashed and raw per-bet records are not redistributed.
The Polymarket comparison cohort is the frozen V1 cohort from Convexly (2026): 8,656 wallets with at least five resolved positions, active through April 18 2026. Per-pillar values and fitted coefficients come from the committed validation report in the Convexly repository.
The findings below are computed on Polymarket and Manifold only.
Three pillars, two venues, different coefficients
The Edge Score V3b composite is a three-feature, OLS-fit ranking on signed log PnL, introduced in Convexly (2026). The three features are:
- Posture, the z-score of minus skill_brier. Positive values mark users whose profit is earned despite imprecise calibration.
- Conviction, the z-score of log concentration. Positive values mark portfolio concentration in a single dominant event.
- Discipline, the z-score of minus log position count. Positive values mark fewer, larger bets.
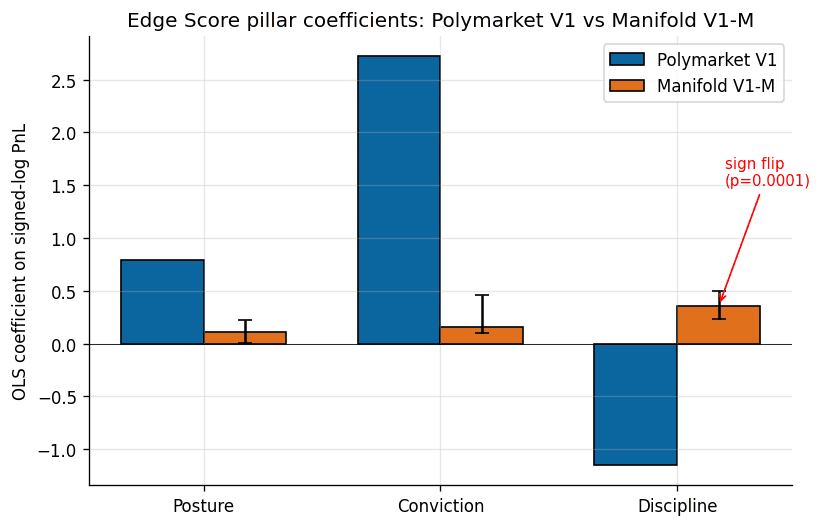
Fitted on Polymarket, the coefficients were +0.79, +2.72, and -1.15. Conviction dominated by a factor of three-to-one. Discipline loaded negatively, which is to say: on a real-money venue where the fitted cohort is a positive-profit leaderboard, users who hold fewer resolved positions earn more signed PnL per unit of raw feature value.
Refit on the 15,106-user Manifold cohort with the V3b-M multi-outcome extension (one-vs-rest Brier for MULTIPLE_CHOICE cpmm-multi-1 markets; backward-compatible with V1 on binary-only data within floating-point precision), the same three features produce three different coefficients.
| Pillar | Polymarket V1 | Manifold V1-M | Bootstrap 95% CI | Permutation p |
|---|---|---|---|---|
| Posture | +0.79 | +0.11 | (+0.003, +0.22) | 0.049 |
| Conviction | +2.72 | +0.16 | (+0.10, +0.46) | 0.0013 |
| Discipline | -1.15 | +0.36 | (+0.23, +0.50) | 0.0001 |
Three observations, in ascending order of how surprising they were to us.
Posture is smaller on Manifold, same sign. The play-money platform rewards calibration, just not as much as the real-money platform does. This is the least surprising finding in the paper and the easiest to rationalize: Manifold makes per-user calibration plots a first-class product feature, so users who optimize for the visible leaderboard metric would be expected to show a positive posture coefficient.
Conviction collapses by a factor of seventeen. The dominant pillar on Polymarket drops to noise on Manifold. What concentrates PnL on real money barely moves the needle on play money.
Discipline flips sign with a permutation p of 0.0001 across 10,000 shuffles. On Polymarket, more positions predicts lower realized PnL. On Manifold, more positions predicts higher realized PnL. The bootstrap 95% CI bands (-1.21 to -1.09 on Polymarket per the V1 validation report; +0.23 to +0.50 on Manifold V1-M) do not overlap.
We stratified the Manifold cohort by bet count to test whether the discipline flip is an artifact of the long tail of low-activity users. It is not. The coefficient holds the same sign in every activity stratum (+0.07 among 20-50 bet users, +0.08 among 51-200, +0.37 among 201-1,000, +0.37 among 1,000+). In the whale subcohort the posture coefficient swings up to +1.03, comparable in magnitude to Polymarket's +0.79. Conviction in the whale subcohort reaches +0.94, still well below Polymarket's +2.72. The direction of the discipline flip is structurally stable.
The methodology transfers. The coefficients do not.
Fat tails below a mathematical boundary
Hill alpha is a standard tail-index estimator for heavy-tailed distributions. The convention in financial-market literature is to read alpha as “how fat is the tail.” Equities sit around 3.5. Hedge fund returns cluster at 2 to 3. Below 2, the variance of the return distribution is formally undefined. Below 1, even the mean is undefined.
The V1 paper reported alpha = 1.28 on per-user PnL for the 8,656-wallet Polymarket cohort, 95% bootstrap CI (1.20, 1.36). The same estimator applied to the 15,106-user Manifold V1-M cohort returns alpha = 0.86, 95% bootstrap CI (0.80, 0.93). The CIs do not overlap. The play-money venue is measurably more fat-tailed than the real-money venue by this measurement.
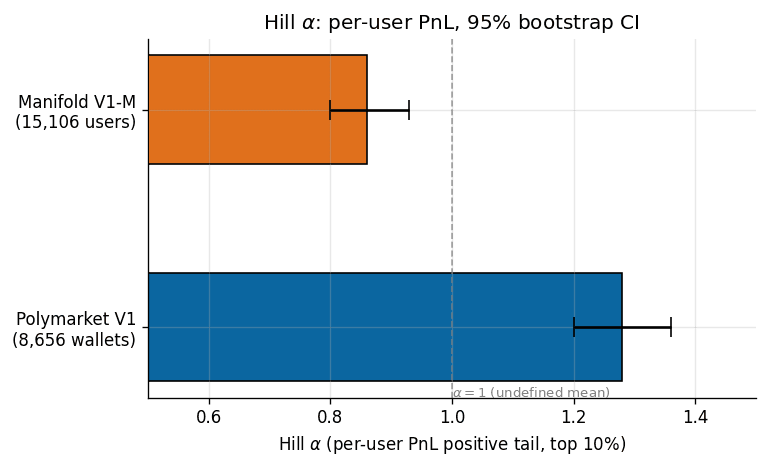
Before explaining why this is a surprising finding at all, it is worth acknowledging what alpha = 0.86 means arithmetically. It means the population expected value of Manifold per-user PnL under this empirical tail shape is not well-defined. Any point estimate of average per-user profit in the cohort is an accident of where the sampling stopped. The one-in-a-million outcome is not well-characterized by the one-in-a-thousand one.
The intuition the naive reader brings to this comparison is that real money makes people take bigger risks. Under this intuition, the real-money venue should have fatter per-user tails than the play-money venue. The data argue the opposite. Across 15,106 Manifold users and 8,656 Polymarket wallets, per-user PnL is more fat-tailed on the play-money venue by a gap that survives bootstrap resampling and does not depend on cohort-construction choices we tested.
Two mechanisms are consistent with this direction. First, play-money Manifold has no ruin barrier. A user who loses 99% of their mana continues to trade. A Polymarket wallet that loses 99% of its capital typically stops. This produces different survivorship structure across the two visible cohorts, and that survivorship structure biases the measured tail shape in different directions. Second, the average Manifold balance is small (500 to 5,000 mana is typical) and the average market is thin (100 to 1,000 mana total pool), so a single serious bet can dominate a user's realized PnL. This is the same mechanism visible in the median-concentration inversion: Manifold users concentrate more within their own portfolios (median 0.87 versus Polymarket's 0.51) and the platform as a whole concentrates the heavy-hitter tail in a smaller share of users.
The bet-level Hill alpha is also available on Manifold. On per-bet notional (mana amount on Manifold; no Polymarket equivalent available in our data), alpha sits at 0.91 on Manifold, higher than the 0.86 Manifold per-user estimate. The within-venue gap between the two aggregation levels implies that part of the user-level tail shape is driven not by bet-size distribution but by how bet flow concentrates across users. A licensed third-venue bet-level comparison is on the roadmap, pending a data partnership.
The sweepcash within-user paired comparison
The cross-venue coefficient divergence and the cross-venue Hill-alpha gap both carry an obvious confound: the users on Polymarket and the users on Manifold are not the same people. Identity-matching across the two venues was attempted in the paper via a three-tier heuristic (exact username, bio-referenced cross-venue identity, shared linked social accounts) and yielded zero CERTAIN, zero PROBABLE, and two CANDIDATE matches on an 8,698-wallet pilot. A within-person cross-venue test is not possible with the available data.
What is possible is a within-person paired-window comparison, thanks to Manifold's own sweepcash program.
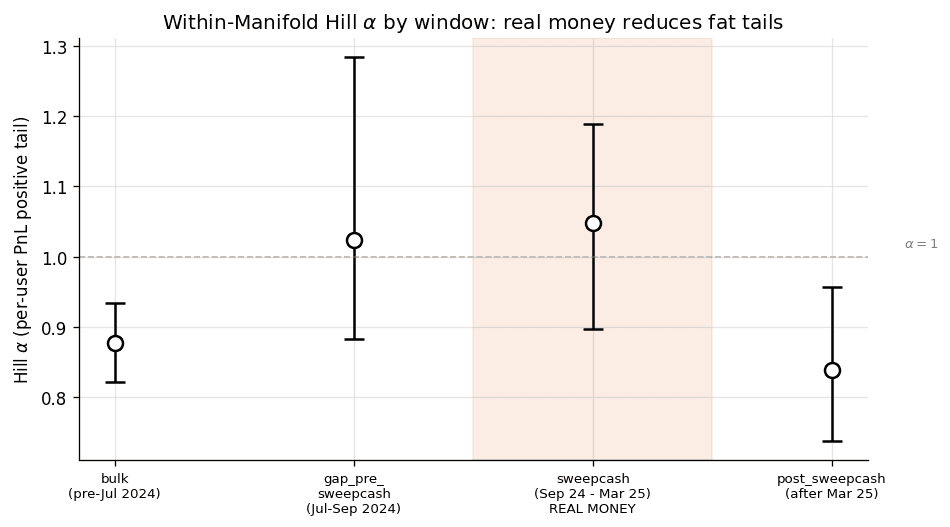
From September 25 2024 through March 28 2025, selected Manifold markets had a real-money variant redeemable for US dollars, operating in parallel with the mana markets on the same platform. Then the program shut down. We partition the Manifold bet stream into four windows by timestamp: bulk (before July 2024), gap_pre_sweepcash (July through September 2024), sweepcash (September 2024 through March 2025), and post_sweepcash (after March 2025). For each window, we compute the same per-user statistics we used in the full-cohort analysis, subject to a ten-resolved-bet floor within the window.
Window-level Hill alpha on per-user PnL:
| Window | Users | Median concentration | Hill alpha | 95% CI |
|---|---|---|---|---|
| bulk | 16,464 | 0.88 | 0.88 | (0.82, 0.93) |
| gap_pre_sweepcash | 2,435 | 0.93 | 1.02 | (0.88, 1.28) |
| sweepcash (real money) | 3,600 | 0.91 | 1.05 | (0.90, 1.19) |
| post_sweepcash | 5,075 | 0.99 | 0.84 | (0.74, 0.96) |
The sweepcash-window alpha of 1.05 has overlapping 95% CIs with the gap-pre-sweepcash bridge alpha of 1.02 (no formal TOST equivalence test was pre-registered, so we are not claiming statistical equivalence here) and is closer to the Polymarket V1 alpha of 1.28 than to the bulk-window play-money baseline of 0.88. After sweepcash ends, alpha reverts to 0.84, with a CI whose upper bound (0.96) barely touches the sweepcash-window CI's lower bound (0.90). The window-level pattern is consistent with the hypothesis that sweepcash-period activity shifted the tail shape of per-user PnL toward the real-money venue comparison, but this descriptive pattern is not a causal estimate.
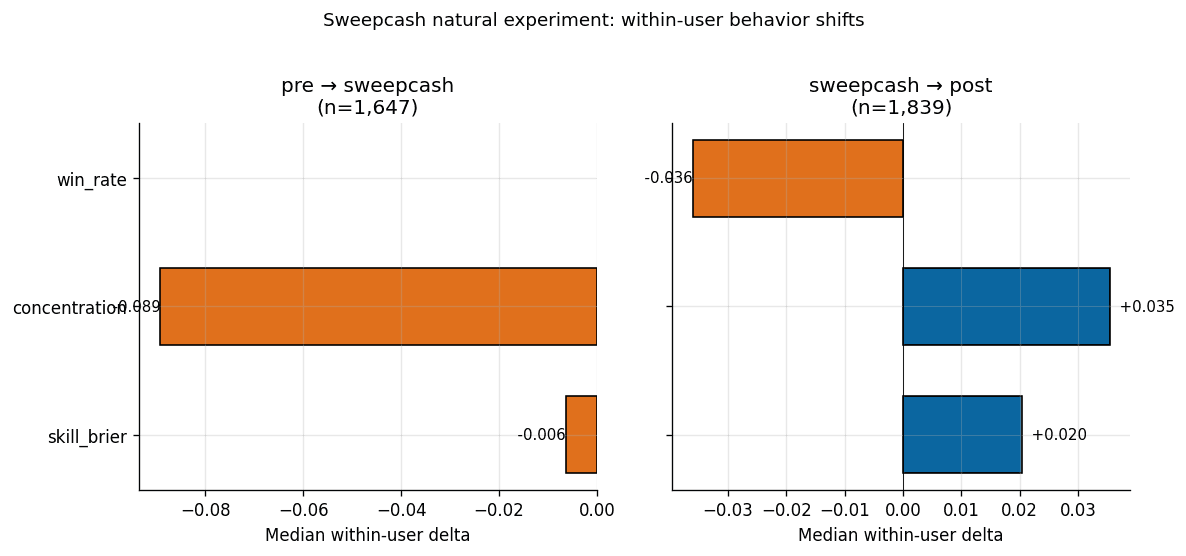
The within-user comparison tests the same hypothesis at the individual level. For users active in both pre-sweepcash and sweepcash windows (n = 1,647), we compute the delta of their concentration and skill_brier metrics across windows, user by user. The original 2026-04-22 public-bundle median deltas are retained below for audit traceability; the skill_brier column is superseded by the 2026-05-04 recovered-cohort update.
| Transition | Users | Median delta concentration | Median delta skill_brier (original; superseded) |
|---|---|---|---|
| pre-sweepcash → sweepcash | 1,647 | -0.089 | -0.006 |
| sweepcash → post-sweepcash | 1,839 | +0.035 | +0.020 |
The original public bundle's concentration delta 95% bootstrap CI excludes zero on the pre→sweepcash transition (median -8.9pp, 95% CI [-17.0, -1.1], Wilcoxon signed-rank p = 0.0137 on the n=333 defined-delta sub-sample). The 2026-05-04 recovered-cohort politics-excluded sensitivity arm reports -9.2pp, 95% CI [-12.8, -3.6], p=0.0021 on n=515 of 1,208 paired users. The sweepcash→post reversal is directionally consistent but filter-sensitive: the recovered baseline reports +8.1pp with a CI excluding zero, while the politics-excluded arm reports +3.0pp, 95% CI [-0.2, +7.3], p=0.056. The conservative reading is that the reversal remains suggestive, not settled. The calibration secondary claim is superseded because the recovered-cohort skill_brier deltas are reported with confidence intervals that include zero at the reported scale.
The within-person comparison reported here addresses a specific gap left by the closest prior result we are aware of: Servan-Schreiber, Wolfers, Pennock, and Galebach (2004) compared real-money TradeSports to play-money NewsFutures on 208 NFL games and found no market-aggregate accuracy difference. Their comparison was at the market-aggregate level, across different populations on different platforms. The present comparison is at the individual level, across the same platform and partially overlapping users, with the important caveat that the market catalog also changed across the window. We have not found a published prior result with this exact design.
What it does not show
The finding here is narrower than the popular summary “real money makes people more careful.”
It is true that concentration was lower in the sweepcash window in a measurable, within-person way on this sample, and that the conclusion survives the politics-excluded sensitivity rerun. It is not true that the recovered-cohort rerun shows improved calibration (it does not). It is not true that sweepcash makes users more profitable in a way we can measure (median realized PnL within each window is negative and noisy, as it is on any cohort whose enrollment is conditional on losses being realized). It is not true that users who perform well on one venue will perform well on another. Our identity-match cohort is too small to test cross-venue within-person skill transfer, and that remains a gap in the cross-venue prediction-market literature.
It is also not true that the Edge Score “doesn't transfer” in the strong sense. The measurement framework transfers. We re-ran the same three-pillar decomposition, the same z-scoring procedure against cohort-local moments, the same OLS fit against signed log PnL, the same 10,000-shuffle permutation null, on the same kind of input data, and got sensible, confidence-interval-bounded outputs on both venues. The pillars are well-defined on Manifold. The z-scores are well-defined on Manifold. The OLS fit converges. What does not transfer is the magnitude and in one case the sign of the fitted coefficients. An analyst who ported Polymarket's coefficients directly onto Manifold data would rank users in roughly the opposite order on the discipline axis and would overweight conviction by an order of magnitude. The artifact would look like a model. It would not be one.
Where the methodology lands
Two takeaways follow from the results above.
The first is for anyone who studies skill in prediction markets empirically. Any claim that a skill measure “generalizes” across venues needs to commit, up front, to whether it is claiming framework portability (the same pillars, the same feature definitions, the same statistical apparatus produce well-defined outputs on each venue) or coefficient portability (the same numerical coefficients rank users comparably across venues). On our evidence, framework portability holds and coefficient portability does not. A paper that claims the latter owes the reader a coefficient-stability test. A paper that claims only the former owes the reader a venue-specific refit protocol.
The second is for anyone who operates a prediction market or builds analytics on top of one. The per-venue incentive regime is a first-order determinant of the structural relationships between trader-level features and profit outcomes. It is not a second-order nuance. A tool that scores a Polymarket wallet's skill and then rescores the same user's Manifold activity using the same coefficients is not producing a consistent score; it is producing three different measurements under a shared label. This is a solvable problem (refit per venue, version the coefficients, expose the coefficient set alongside the score) but it has to be solved intentionally, not assumed away.
These findings are not claims about individual trader talent. They are claims about what happens to a measurement when the environment the measurement is computed in changes. The original public bundle's -8.9pp concentration delta and the recovered politics-excluded -9.2pp delta do not tell you that a particular Manifold user became “more careful.” They tell you that a paired cohort moved by enough to clear the specified confidence-interval and signed-rank tests, even after removing political/election markets. That movement is enough to change how a skill composite scores the same cohort across two windows, which is enough to argue that a cross-venue product that ignores venue and regime context is misspecified.
Paper, data, and reproduction
The full paper runs to 19 pages and includes the complete methodology, cohort-construction pseudocode, coefficient tables with bootstrap CIs and permutation nulls, activity-stratified sub-cohort analysis, discussion of survivorship and ergodicity, and a limitations section on the identity-match gap and the pending licensed third-venue comparison.
The data bundle contains 15,106 rows of aggregated per-user metrics (SHA-256 hashed identifiers), the full sweepcash window analysis, the refit coefficient tables with bootstrap 95% CIs and permutation null p-values, and a stdlib-only Python script that re-pulls the Manifold /v0 API and recomputes the pillars for any supplied cohort. The 2026-05-04 sensitivity JSON adds the recovered-cohort politics-excluded rerun requested after publication; it is not a byte-identical rebuild of the original 2026-04-22 bundle. Raw per-bet records are not redistributed. See README and LICENSE in the bundle.
Convexly publishes new methodology research roughly every 6-8 weeks. Get the next paper in your inbox when it ships:
Operator reading
For the product-tied read of what this means if you are about to size a real-money position, see the companion operator post: What the discipline inversion means if you actually trade.
References
Akey, P., Gregoire, V., Harvie, N., and Martineau, C. (2026). Who Wins and Who Loses In Prediction Markets? Evidence from Polymarket. SSRN 6443103.
Atanasov, P., Witkowski, J., Mellers, B., and Tetlock, P. (2024). Crowd Prediction Systems: Markets, Polls, and Elite Forecasters. International Journal of Forecasting.
Convexly (2026). Edge Score Methodology V1.
Le, N. A. (2026). Decomposing Crowd Wisdom: Domain-Specific Calibration Dynamics in Prediction Markets. arXiv:2602.19520.
Manifold Markets (2024). Public bulk data dump.
Peters, O. (2019). The ergodicity problem in economics. Nature Physics, 15, 1216-1221.
Reichenbach, S., and Walther, A. (2025). Exploring Decentralized Prediction Markets: Accuracy, Skill, and Bias on Polymarket. SSRN 5910522.
Servan-Schreiber, E., Wolfers, J., Pennock, D., and Galebach, B. (2004). Prediction Markets: Does Money Matter? Electronic Markets, 14(3), 243-251.
Taleb, N. N. (2026). Lindy as Distance from an Absorbing Barrier. Wilmott magazine, April 2026, 68-71.
Wolfers, J., and Zitzewitz, E. (2004). Prediction Markets. Journal of Economic Perspectives, 18(2), 107-126.
AI tooling disclosure
This work used AI tools (Claude, GPT-4) as research aids during methodology design and pre-publication review. All claims, statistical results, and figures are reproducible from the public V1-M data bundle and the documented reproduce.py script. No claim on this page is taken as true on the basis of an AI tool's output; every quantitative result is recomputable from the bundle with the documented seed.